

The Hunt for a Strong, Stable, National Conservative Majority: The Conservative Party’s Voter Universe
Part 2 of my series looking at the voter universes of the main federal political parties in Canada

So much attention is paid to the horserace, even when we are likely at least a year or more from the next federal election. I think it's far more valuable to understand how a party might grow or shrink by focusing on its accessible pool of voters.
This is the second installment of my in-depth look at the voter universes for Canada's main political parties, in which I delve into the accessible voter pool of the Conservative Party of Canada.
Based on polling data and trends since 2015, we'll examine the party's vote share, voter accessibility, regional and demographic support, and the challenges and opportunities it faces in the political landscape.
I went into Abacus Data's poll archive and looked at our most recent national survey conducted in mid-March to gather the evidence and data for this post.
Here's what I found:
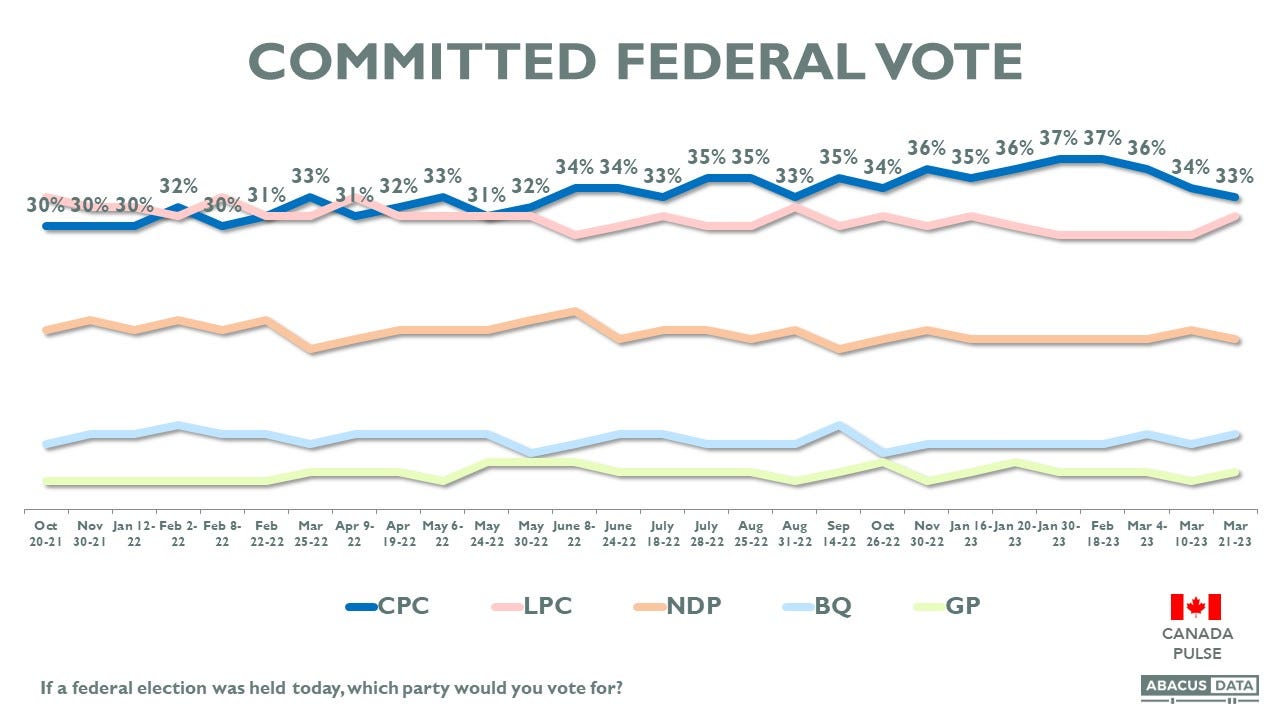
Since the last federal election, the Conservative Party's vote share among committed voters has fluctuated from a low of 30% to a high of 37%.
In 2021, the party received 34% of the vote, so its average level of support over the last 18 months has been about the same as its vote share in the last election.
Given the Conservative Party's inefficient vote, it will likely need to win the national popular vote by at least five points to win a majority, meaning getting close to 40% of the popular vote. A quick simulation using 338Canada's tool (https://338canada.com/sim.htm) with the Conservatives at 37%, the Liberals at 32%, the NDP at 18%, and the BQ at 7% leaves the Conservatives seven seats short of a majority. At 38% with the Liberals at 31%, the Conservatives cross the magic 170 seat number.
So, the main question for the Conservatives is: where will they find the five points needed to win a majority?
The answer lies in understanding the composition of the Conservative voter universe.
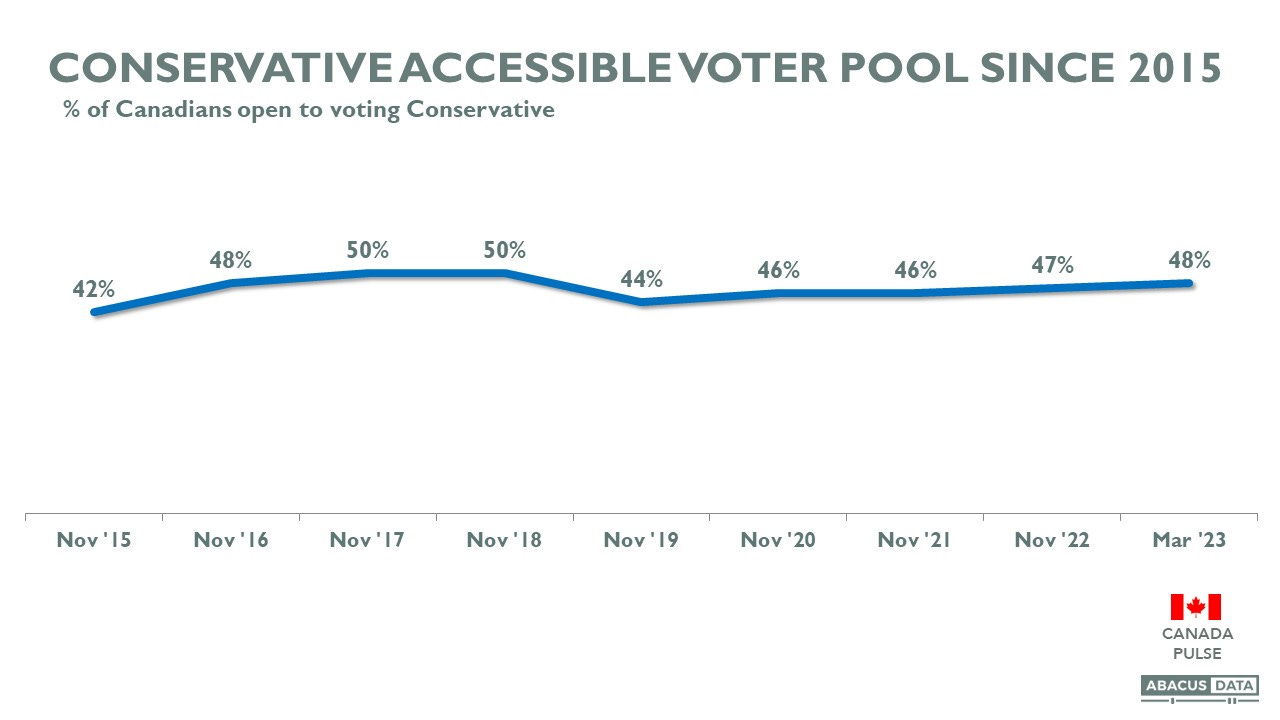
Today, 48% of Canadians would consider voting Conservative, which is higher than the other main political parties (Liberal 45%, NDP 44%). Since 2015, the Conservative Party's accessible voter pool has ranged from 42% to 48%. Since the 2021 election, it has inched up slightly.
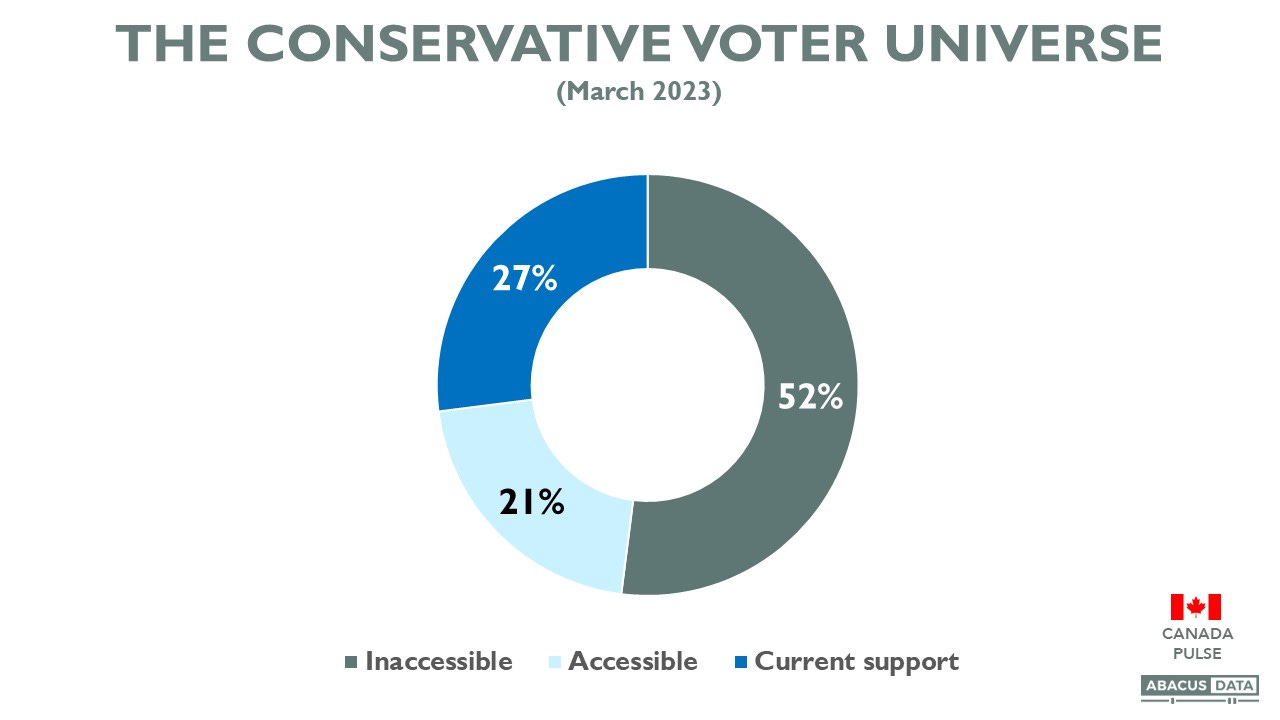
If we look at the Conservative voter universe overall as of mid-March, 27% are current Conservative supporters, 21% are accessible (open to voting Conservative but not currently supporting the party), and 52% are inaccessible to the Conservatives. I'll focus on these three groups for the rest of this post.
Regional and Demographic Subgroups:
The Conservative Party has the largest accessible voter pools in the Prairies, Atlantic Canada, and Ontario.
Only 29% of Quebecers say they are open to voting Conservative, demonstrating the clear challenge for the party in that province. Even if they convert every accessible voter into a party supporter, the ceiling for the Conservatives in Quebec is 29%.
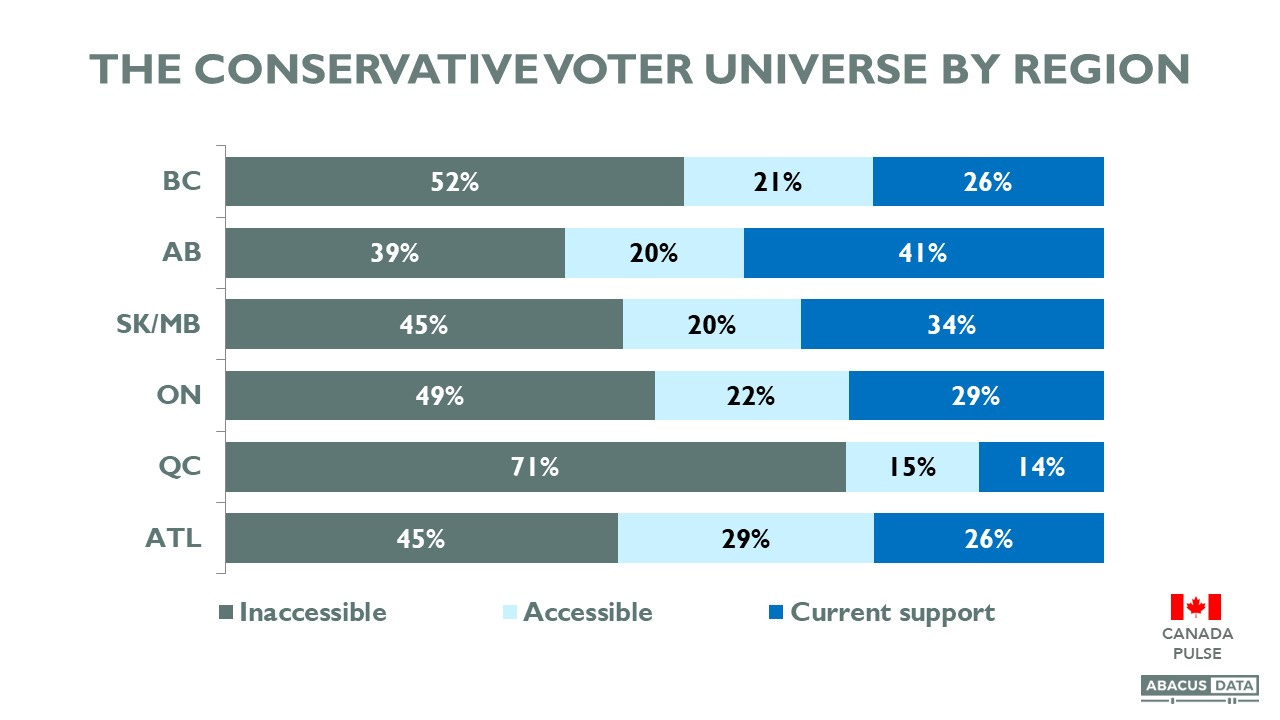
Strategically, there is significant room to grow in Ontario, British Columbia, and especially Atlantic Canada, where the accessible voter pool is larger than the pool of those who currently support the party.
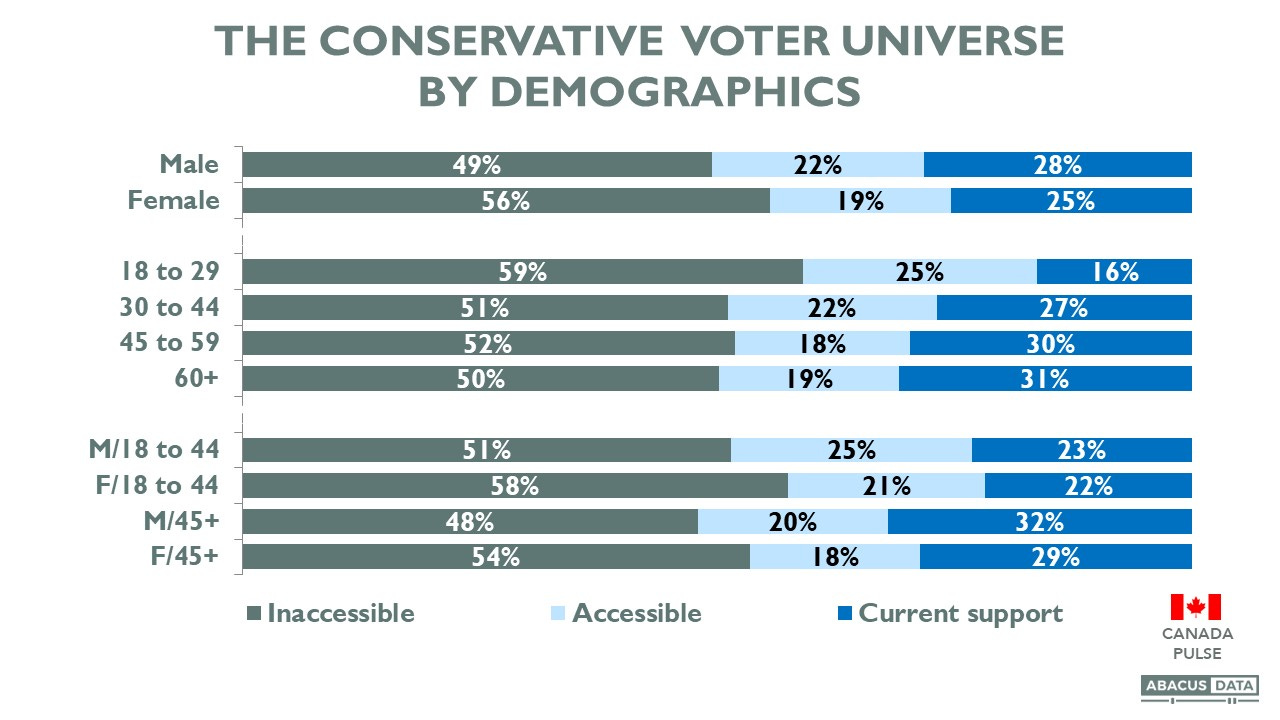
The party has a larger pool of potential support among men than women (51% vs. 44%) and generally more support and a larger accessible pool among older voters. The most difficult demographic for the Conservatives is women under 45 – only 42% are open to voting Conservative.
Ideological Identity:
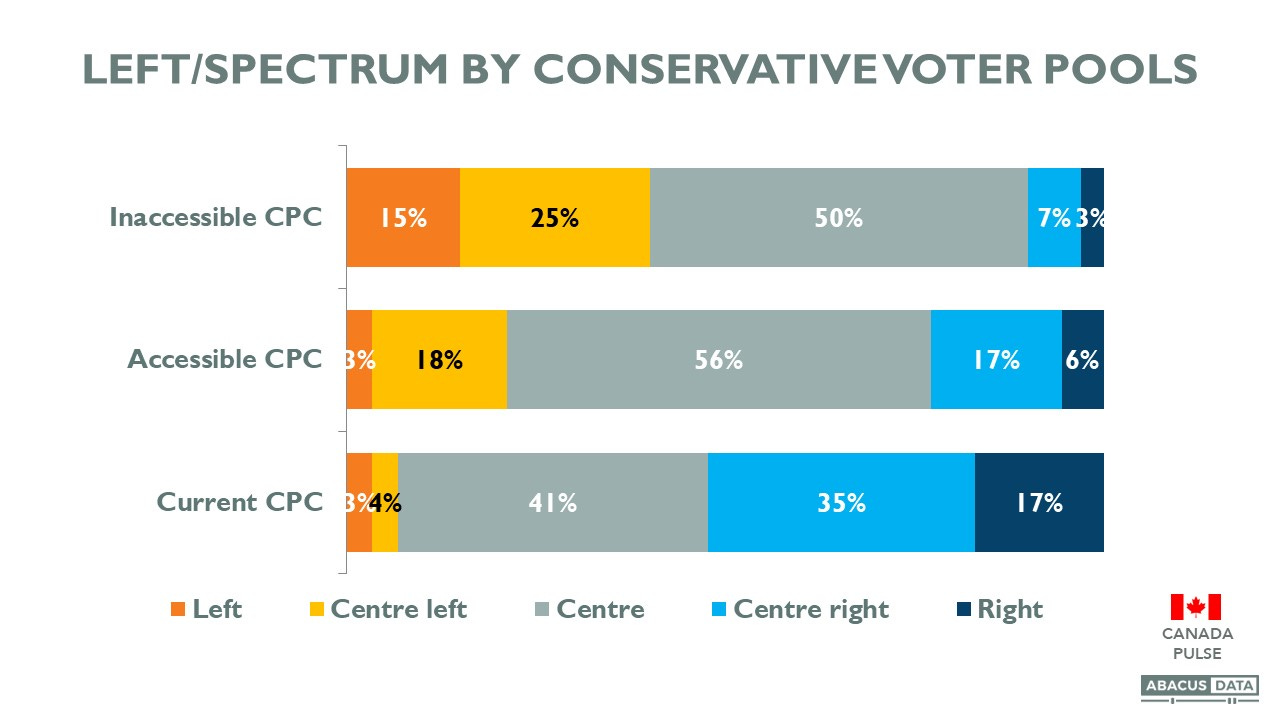
Among current Conservative supporters, 52% identify on the right side of the political spectrum, 41% in the center, and 7% on the left. Accessible voters are more centrist, with 56% in the middle and about equal numbers leaning left and right.
Current and Past Vote:
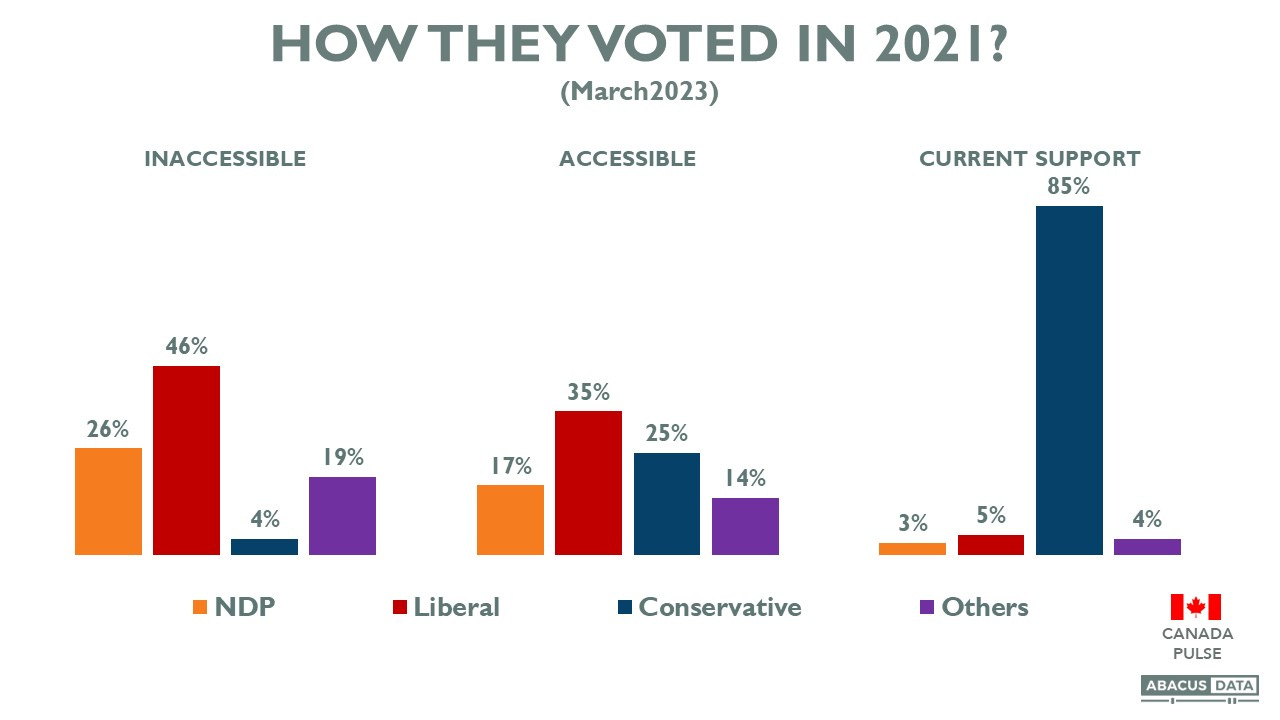
85% of current Conservative supporters voted Conservative in 2021. 5% voted Liberal and 7% split their votes between the NDP and other parties. Among Conservative accessible voters, 1 in 3 voted Liberal in 2021, 25% voted Conservative, 17% voted NDP, and 14% voted for another party. Getting those past Conservative voters back is step one and the easiest path to winning a majority. This group represents 5% of the electorate.
They voted Conservative in 2021 but today aren't willing to commit a vote for the party. They are open to doing so but haven't been convinced. When asked how they would vote today if an election were held, among accessible Conservatives, 33% would vote Liberal, 15% would vote NDP, 18% for another party, and 35% are undecided. Of note, 2% say they would vote for the People’s Party.
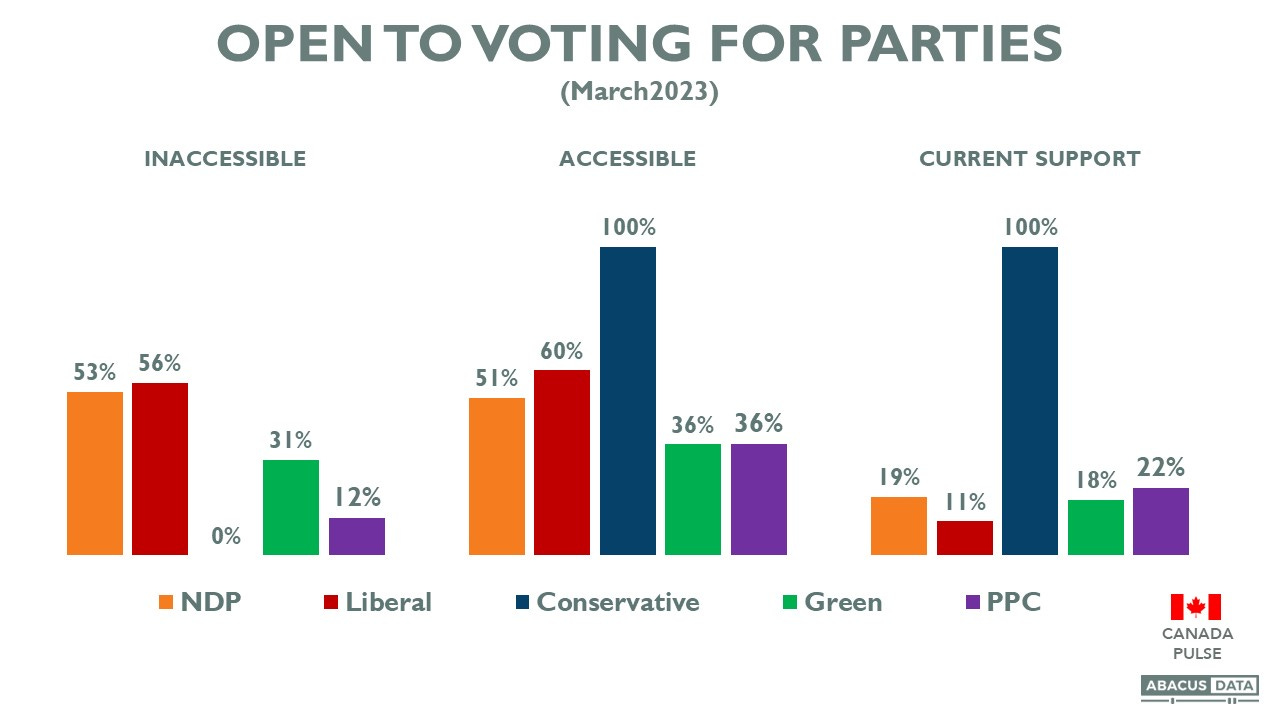
Overlap with Other Parties:
Among current Conservative supporters, 22% are open to voting for the People’s Party, 19% NDP, 18% Green, and 11% Liberal. Among accessible Conservative supporters, 60% are open to voting Liberal, 51% NDP, 36% People’s Party, and 36% Green.