


Creating a New Orange Wave? Exploring the federal NDP voter universe
Part 1 of my series looking at the voter universes of the main federal political parties in Canada

So much attention is paid to the horserace, even when we are likely at least a year or more from the next federal election.
I think it’s far more valuable to understand how a party might grow or shrink by focusing on its accessible pool of voters.
This is the first installment of my in-depth look at the voter pools for Canada's main political parties in which I delve into the accessible voter pool of the federal New Democratic Party. Based on polling data and trends since 2015, we'll examine the party's vote share, voter accessibility, regional and demographic support, and the challenges and opportunities it faces in the political landscape.
I went into Abacus Data’s poll archive and looked at our most recent national survey conducted in mid-March to gather the evidence and data for this post.
Here’s what I found:
Since the last federal election, NDP's vote share among committed voters has been relatively stable, ranging between 17% and 21%, averaging around 18% since the last federal election.
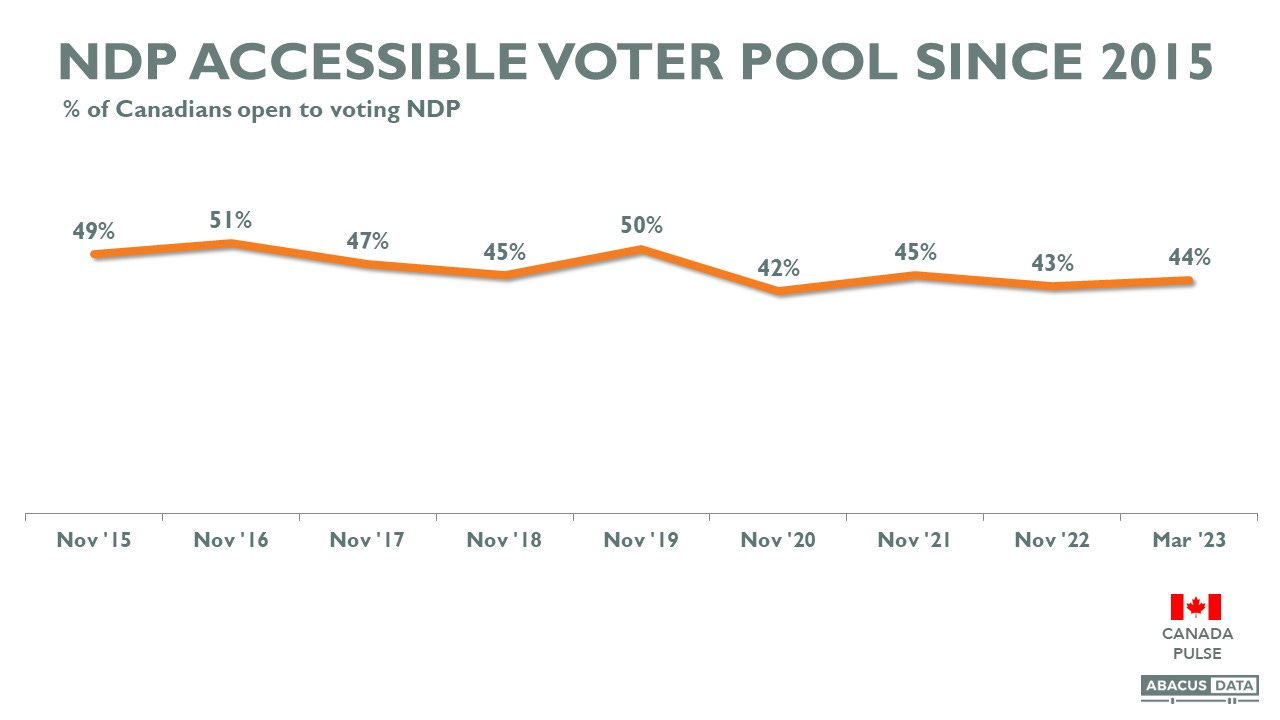
NDP's accessible voter pool is slightly smaller than in previous years, hovering around the low 40s since 2020.
Today, 44% of Canadians would consider voting NDP, which is lower than the 45% considering the Liberals and the 48% open to voting Conservative.

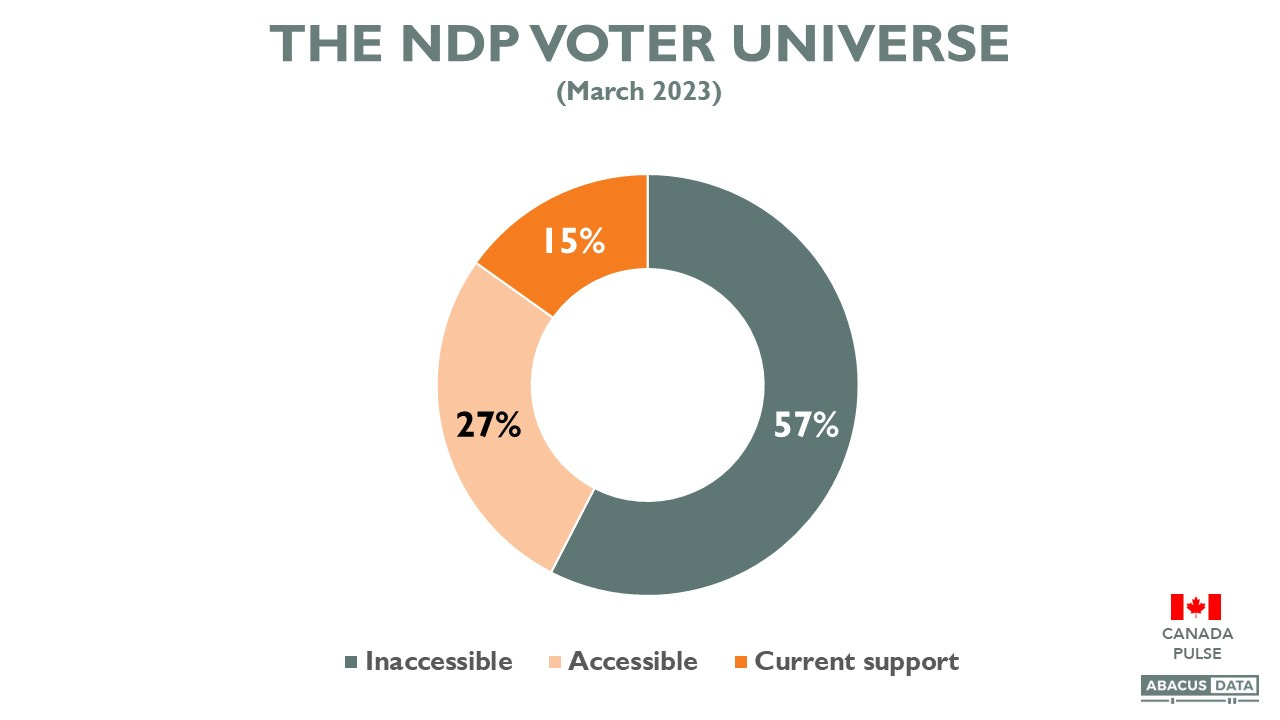
Digging back into the NDP numbers, If we look at the NDP voter universe overall as of mid-March, 15% are current NDP supporters, 27% are accessible (open to voting NDP but not currently supporting the party), and 57% are inaccessible to the NDP.
I’ll focus on these three groups for the rest of this post.
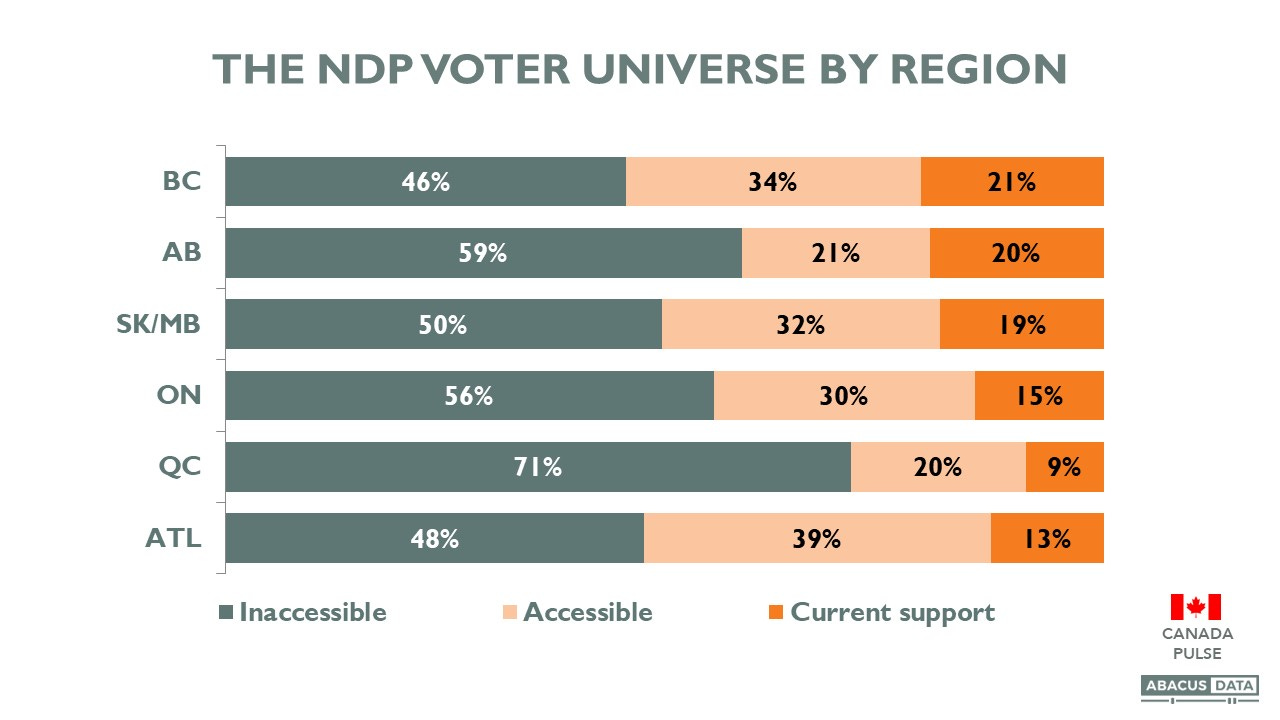
Regional and Demographic Subgroups:
The NDP has the most support and room to grow in BC, Manitoba, Saskatchewan, Ontario, and Atlantic Canada. Quebec poses the most significant challenge, with 71% of residents not open to voting NDP.
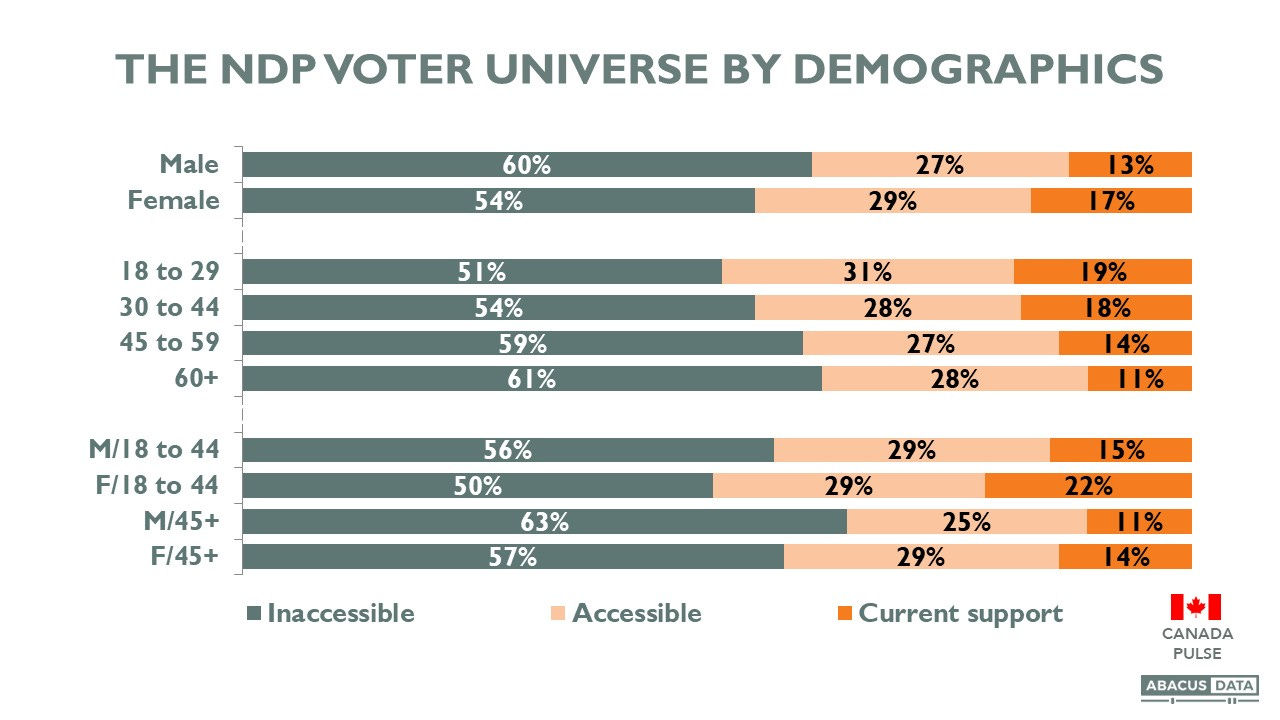
The party has a larger pool of potential support among women, especially younger women (50% of women under 45 are open to voting NDP).
The most difficult demographic for the NDP is older men, with only 37% open to voting NDP.
Ideological Identity:
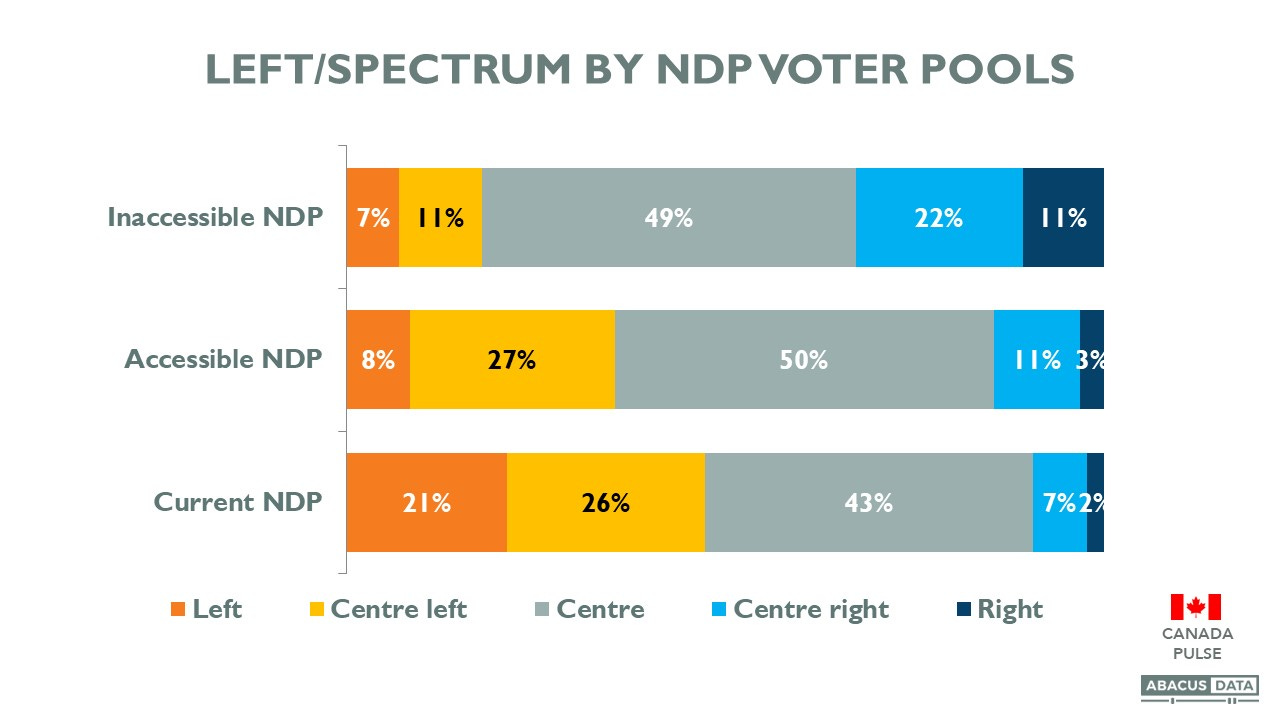
Among current NDP supporters, 47% identify on the left side of the political spectrum, 43% in the center, and 9% on the right.
Among accessible NDPers, 35% are on the left, 12% on the right, and 50% are in the center.
Current and Past Vote:
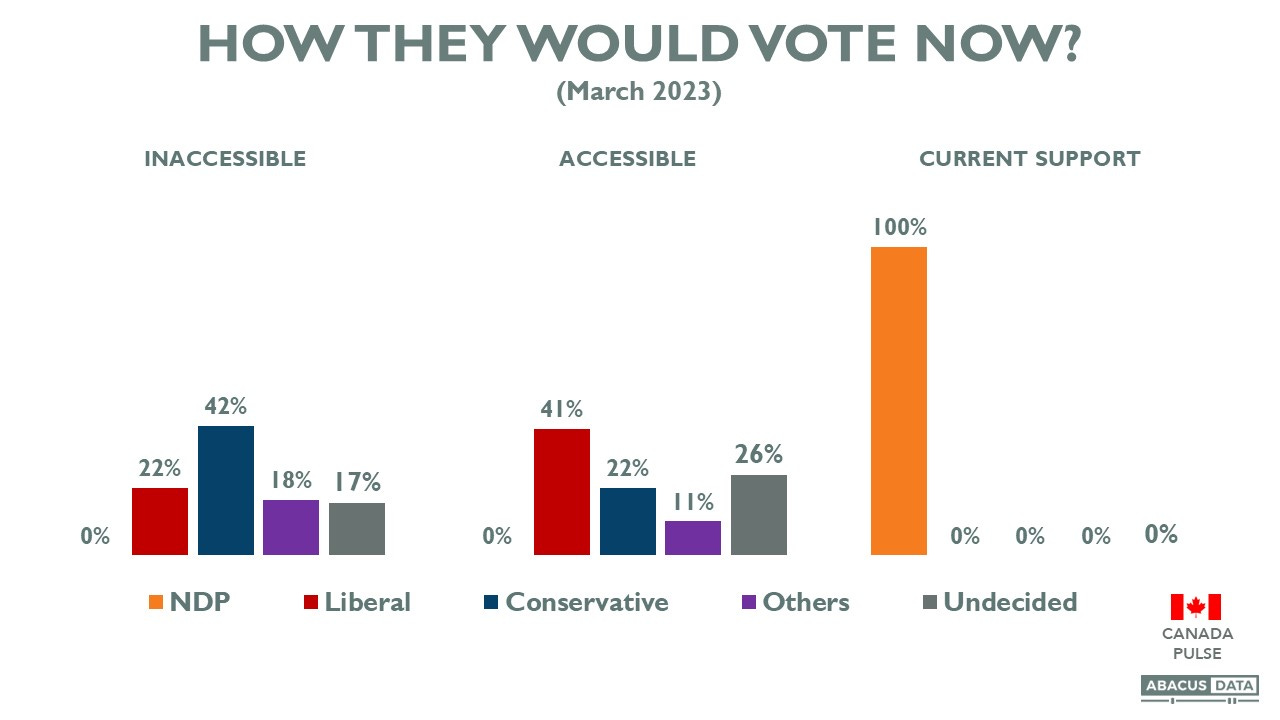
84% of current NDP supporters voted NDP in 2021. 11% voted Liberal and 5% split their votes between the Conservatives and the other parties.
Among NDP accessible voters, half voted Liberal in 2021, another 2% voted Conservative, 11% voted NDP (and now aren’t currently supporting the party) while 11% are supporting other parties.
When asked how they vote today if an election was held, among accessible NDP supporters, 41% would vote Liberal, 22% would vote Conservative, 11% for another party and 26% are undecided.
Overlap with Other Parties:
Among current NDP supporters, 50% are open to voting Liberal, 45% Green, 20% Conservative, and 9% People's Party.